

During the “first wave” of COVID-19 in the United States, Rajan Chakrabarty, the Harold D. Jolley Career Development Associate Professor at Washington University in St. Louis, learned that African Americans made up 47% of the population in St. Louis, but nearly three quarters of COVID-19 cases.
That fact was from an article in the Boston Review, written by Jason Purnell, associate professor at Washington University’s Brown School. In it, Purnell noted that in St. Louis, African Americans were 12 times more likely than white residents to live in conditions with higher environmental risks, including poor air quality.
“It really motivated me to try to connect the dots between environmental injustice and the spread of COVID-19,” said Chakrabarty, who studies aerosol science at the McKelvey School of Engineering.
And as it turned out, aerosol science had much to say about the matter.
New research analyzed disparities in socioeconomic, environmental and lung health factors to determine how they contributed to R0 — the rapidity at which COVID-19 spread — through 12 metropolitan areas. Researchers found just two factors had an overwhelming influence on R0: population density and long-term exposure to air pollution.
Results were published in the journal Environmental Research Letters.
These two factors disproportionately affect communities with more minority residents.
Metropolitan Statistical Areas
- STL | St. Louis (MO & IL)
- CHI | Chicago-Naperville-Elgin (IL, IN, WI)
- DET | Detroit-Warren-Dearborn (MI)
- ATL | Atlanta-Sandy Springs-Alpharetta (GA)
- PHI | Philadelphia-Camden-Wilmington (PA, NJ, DE, MD)
- POR | Portland-Vancouver-Hillsboro (OR & WA)
- DEN | Denver-Aurora-Lakewood (CO)
- NYC | New York-Newark-Jersey City (NY & NJ)
- SFO | San Francisco-Oakland-Berkeley (CA)
- DAL | Dallas-Fort Worth-Arlington (TX)
- CLE | Cleveland-Elyria (OH)
- LOU | Louisville/Jefferson County (KY & IN)
The study, conducted in the Chakrabarty lab, used data from 12 metropolitan statistical areas (MSAs) — a census designation for groupings of counties made up of at least one “urbanized” area of 500,000 or more residents and the nearby areas that it’s tied to socially and economically.
To narrow in on which factors were directly correlated with R0, first author Payton Beeler, a PhD student in the Chakrabarty lab, looked at data from the first wave of the COVID-19 epidemic between March 1 and April 30, 2020, when the strictest stay-at-home orders were in place.
She considered a few dozen factors — from household income to smoking habits to rates of people working in the service industry — that might affect how quickly COVID-19 spread.
To determine PM2.5 exposure over time, Beeler, who was co-advised on this research by C. Arden Pope of Brigham Young University, calculated average mass concentrations by county from 2000 to 2018 using recently published datasets of ground-based observations, NASA’s GEOS-CHEM model outputs and satellite observations. Population density was obtained from the 2019 Census American Community Survey.
Of all the factors they analyzed, “We found that the combined influence of population density and PM2.5 exposure had the most statistically significant correlations with R0,” Beeler said.
Determining if there were any demographic patterns among the areas with a high R0 required a bit of creativity.
Looking at the 12 MSAs together, nothing jumped off the screen. It was because, Beeler realized, she was trying to compare geographic and demographic apples to oranges. Take, for example, the Portland, Ore., MSA. There are no counties in that MSA with a population of African Americans higher than 10%. Taking the MSA as a whole, it looks rather uniform.
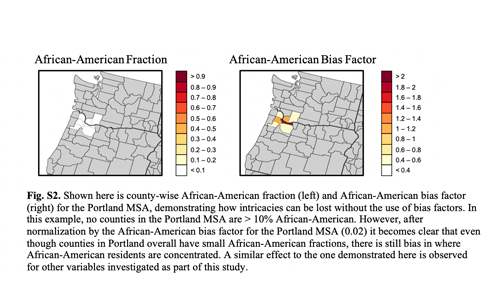
“But if we analyze each MSA individually, what we see is very different,” she said. That’s exactly what she saw in Portland. When she broke the MSA down into counties, she found pockets where minority residents were clustered.
“That’s how I got the idea for the bias factor method.”
The bias factor is a way to level the playing field, so to speak. To find it, she looked at a variable — race or PM2.5 exposure or population density — in a single county in a particular MSA. Then she compared it to the surrounding counties in that same MSA. In that way, any deviations from the average were visible.
For instance, if a county has a bias factor of two for PM2.5 exposure, that means that the PM2.5 concentration in that county is twice as high as the average county in the same MSA. If it has a bias factor of three for Asian Americans, that means it has an Asian American population three times as high as other counties in the MSA.
This method provided a number that could be used to compare counties in Oregon to those in Missouri to those in Georgia — compare apples to apples, despite the wide variation in populations and in factors such as long-term pollution exposure and population density.
When she made those comparisons, Beeler found higher bias factors for diverse counties — those with more racial and ethnic minorities — correlated with bias factors for long-term pollution exposure and higher population density and, therefore, with faster transmission of COVID-19.
Ultimately, the research showed communities with relatively high Hispanic American populations are associated with the largest relative increase in PM2.5 concentration and population density, followed by Asian Americans and African Americans. Researchers also found that communities with relatively large white populations are associated with relative decreases in PM2.5 concentration and population density.