
The amount of opioids prescribed in the United States peaked in 2010 and then decreased each year through 2015, but remains at high levels and varies from county to county in the U.S., according to the latest Vital Signs report by the Centers for Disease Control and Prevention (CDC).
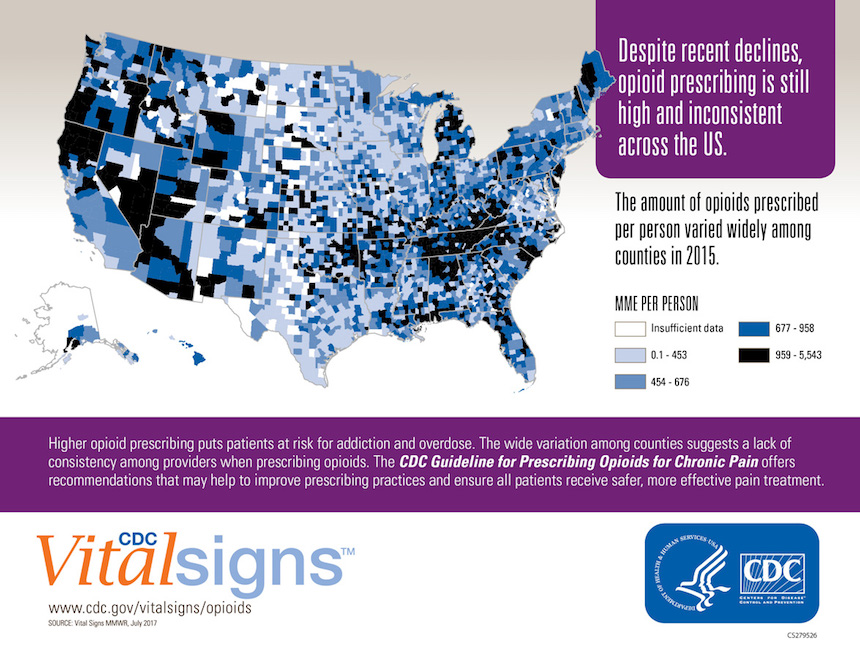
In 2015 six times more opioids per resident were dispensed in the highest-prescribing counties than in the lowest-prescribing counties. This wide variation suggests inconsistent prescribing practices among healthcare providers and that patients receive different care depending on where they live.
“The amount of opioids prescribed in the U.S. is still too high, with too many opioid prescriptions for too many days at too high a dosage,” said Anne Schuchat, M.D., acting director of the Centers for Disease Control and Prevention. “Healthcare providers have an important role in offering safer and more effective pain management while reducing risks of opioid addiction and overdose.”
CDC researchers analyzed changes in annual prescribing measures from 2006 to 2015 and found that while there have been declines in the amount of opioids prescribed, more can be done to improve prescribing practices. For example, between 2006 and 2015 the amount of opioids prescribed peaked in 2010 at 782 morphine milligram equivalents (MME) per person and decreased to 640 MME in 2015. (MME is the amount of opioids in milligrams, accounting for differences in opioid drug type and strength.)
Daily MME per prescription remained stable from 2006 to 2010 and then decreased 17 percent from 2010 to 2015 (from 58 MME to 48). However, the average days’ supply per prescription increased 33 percent from 13 days in 2006 to almost 18 days in 2015. The amount of opioids prescribed per capita in 2015 was still approximately three times as high as in 1999.
County-level opioid prescribing patterns vary
For this Vital Signs report, CDC analyzed retail prescription data from QuintilesIMS to assess opioid prescribing in the United States from 2006 to 2015, including rates, amounts, dosages, and durations prescribed. CDC examined county-level prescribing patterns for the years 2010 and 2015.
County-level factors associated with higher amounts of opioids prescribed include:
A greater percentage of non-Hispanic white residents.
A greater prevalence of diabetes and arthritis.
Micropolitan areas (non-metro small cities and big towns).
Higher unemployment.
“While some variation in opioid prescribing is expected and linked to factors such as the prevalence of painful conditions, differences in these characteristics explain only a fraction of the wide variation in opioid prescribing across the United States,” said Deborah Dowell, M.D., M.P.H., chief medical officer in the Division of Unintentional Injury Prevention at CDC’s National Center for Injury Prevention and Control. “This variation highlights the need for healthcare providers to consider evidence-based guidance when prescribing opioids.”